Initiative details
In today’s digital age, more and more data is collected every day in the field of transportation. Still, authorities solely rely on historical traffic accident data to detect black spots. This leads to the shortcoming that accidents must happen before measures are taken. Additionally, in relation to a specific location on the traffic network, traffic accidents are rare events. Thus, for credibly evaluating the safety of a road element, several years of traffic accident data are needed. As a result, road users are put at an unnecessary risk if measurements are taken too late. There is therefore an urgent need to take new paths in the field of road safety analysis. Our EDDA+ road hazard map detects potential dangers in road traffic at an early stage by combining existing safety-relevant data with new data sources.
Initiative date
to
Who was/is your target audience?
Policy makers
Public authorities
Children 0-16
Young adults 17-25
Adults
Parents
Seniors
Company employees
Fleet operators
Car drivers
Car drivers – professional
Educational staff
Van drivers
Lorry/truck drivers
Cyclists
Micromobility riders
Powered two wheeler riders (excluding micromobility)
Pedestrians
Topic
Create awareness
Improve vehicles and infrastructure
Organisation details
Initiative für sichere Straßen GmbH
Enterprise
Germany
Bonn
Contact name
Michaela Grahl
Telephone number
+49 228 76386914
m.grahl@sichere-strassen.org
Website link
Project activities
If you work together with external partners, list the most important partners and briefly describe their role.
The Institute of Highway Engineering Aachen (ISAC): Amongst others a special focus of the institute resides in road construction technology, road planning, operation and traffic engineering, which includes issues like traffic safety and accident research. Within EDDA+ the ISAC is in charge of analysing, processing and validating relevant traffic data generated by different sources.
German Police University (Deutsche Hochschule der Polizei – DHPol) – Department of Traffic Science & Traffic Psychology: The interdisciplinary team of the German Police University consists of scientists and police officers. They contribute their scientific as well as their police related expertise in basic- and applied research to the project.
Planung Transport Verkehr GmbH (PTV): PTV develops software solutions for transport logistics, traffic planning and traffic management. The software Vistad is used by police authorities in 11 federal states of Germany and by various municipalities for accident data collection and analysis. Within the framework of EDDA+ PTV specializes on the data exchange between the police, local authorities and traffic planners as well as on the increased use of this data to improve traffic safety.
DTV-Verkehrsconsult GmbH: Independent engineering consultancy which offers services in the sectors of traffic data, traffic planning, traffic safety and traffic technology. While contributing its expertise in traffic data analysis for local authorities, engineers, universities and private organisations, DTV also provides relevant insights and long-term experience in traffic safety screening (TSS) in the state of Baden-Württemberg.
Please describe the project activities you carried/are carrying out and the time period over which these were implemented.
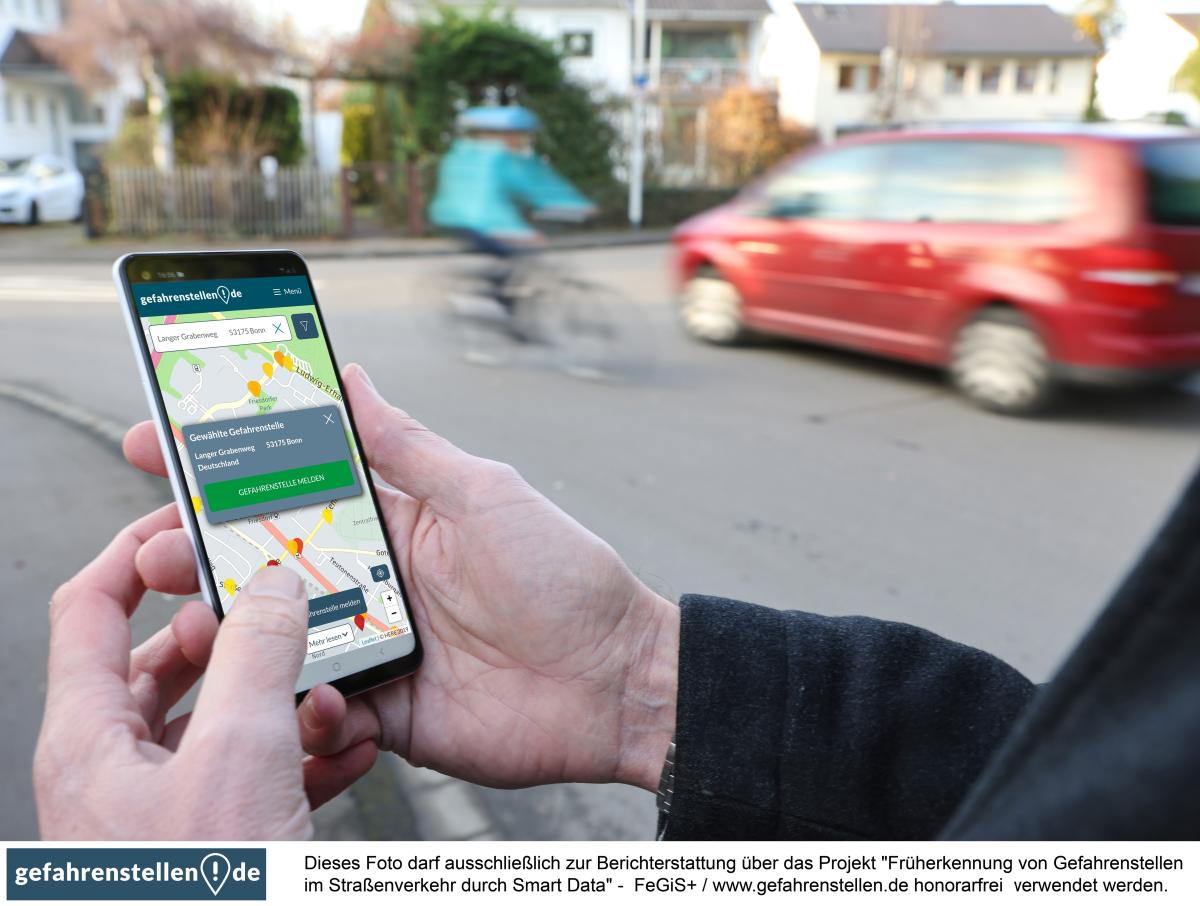
In the last three years we collected following safety-relevant data: detailed traffic accident data (severe and minor crashes) from 14 of the 16 German federal states, crowdsourced data about dangerous spots in road traffic shared by road users on an internet platform/app and vehicle kinematic data. For the second data source, road users can report information about dangerous spots systematically via platform/app “www.gefahrenstellen.de”. The third data source, vehicle kinematic data, describe vehicle motion data from cars and smartphones that indicate safety critical driving manoeuvres, e. g. emergency braking or evasive manoeuvres. Vehicle kinematic data is collected via partner companies that already collect this data.
All these data are blended together into a hazard score for each element of the road network. This comprises two steps. First, a baseline hazard score is calculated based on accident data and safety critical driving manoeuvers. In order to take into account the relationships between accidents and safety critical driving manoeuvres at neighbouring segments, these point events are smoothed over several segments, whereby events closer together are given more weight than events further away. In the second step, user reports on dangerous spots enhance the hazard score for regions where the data is available. The resulting hazard score thus combines a reactive and proactive perspective to further enhance current traffic safety work. The score will be calculated monthly for all road categories and all road users, i.e. for urban and rural street networks as well as for pedestrian, cyclists and motorised road users. This hazard score is already visible on gefahrenstellen.de for the entire road network of 10 German federal states. The remaining federal states will follow by summer 2022.
One important goal for EDDA+ is to make the data available to all those involved in road safety work such as local authorities, police, science, engineering offices, navigation providers and car manufacturers. Since the beginning of the year municipalities and police authorities can already use the data analysis for the road safety work in their region with the EDDA+ analysis tool “Pro-Portal”. Further applications for road users are being developed like a navigation solution for school and kindergarten routes with the option to choose the safest route for pedestrian, cyclists and car drivers or an application for car-drivers to check their driving behaviour. Thus, the new data sources and the hazard score enables many applications for preventive road safety work and is contributing to a greater safety on our roads.
Evaluation
What has been the effect of the activities?
The national hazard map already offers a wide range of possible use cases. Currently, over 7,000 reported danger spots throughout Germany are included in the hazard score. Together with the analysed accident data municipalities can already use the data for the road safety work and their road construction planning. Regular site inspections validated the good data quality.
The platform gefahrenstellen.de can be used to obtain citizen knowledge about ongoing road plannings or about danger spots on school routes. A concrete practical example of this is our cooperation project with a parents' Initiative and the municipal administration of the small town Königs Wusterhausen (federal state: Brandenburg), which started in December 2021. Parents were asked to proactively report danger spots on the routes to school and kindergarten via our platform / app. Until now, 253 danger spots with 2158 supporters and 414 comments were registered on gefahrenstellen.de. The municipal administration is currently processing the information. Some danger spots have already been eliminated.
Further cooperation projects are in planning.
Please briefly explain why your initiative is a good example of improving road safety.
For municipalities: In the EDDA+ analysis tool the hazard score can be filtered by a so-called "early indicator”. This indicator highlights road sections where there is not yet much accident data but a lot of citizen reports and critical kinematic data. Safety measures can be implemented before a section becomes into an accident black spot.
For police: Targeted presence of police at specific danger spots to increase awareness
Road users can adapt their driving behaviour at road sections with high hazard score.
Parents can plan a safer route to school for their children.
For Autonomous driving: data input for risk analysis (Dynamic Risk Management). For example, an autonomous system could react more sensitively at road areas where the hazard score is high.
Safety analysis of aggregated and anonymized data for fleet management.
The EDDA+ approach could be transferred into other European countries. We are already in contact with potential cooperation partners. Interested organizations are welcome to contact us.
How have you shared information about your project and its results?
The hazard score map and the user reports are published on our platform/app www.gefahrenstellen.de . More detailed information about the hazard score and the three data sources are available on our platform “Pro-Portal”, on which organizations from the field of traffic safety work can analyse and work with the data. Through regular press releases and project presentations at events gefahrenstellen.de is known throughout Germany.